Liam Brannigan
Blog post index
Profiling a Polars query
Published on: 10th November 2022
This post was created while writing my Data Analysis with Polars course. Check it out on Udemy
You can’t optimise your code if you don’t know where the bottleneck is.
DataPolars now has a profiling tool to show you what it’s getting up to.
You can get this data by calling .profile on any lazy query. Even better, we can get a plot visualising the time spent on each step.
In this example we read from a CSV file, do a groupby and then a sort.
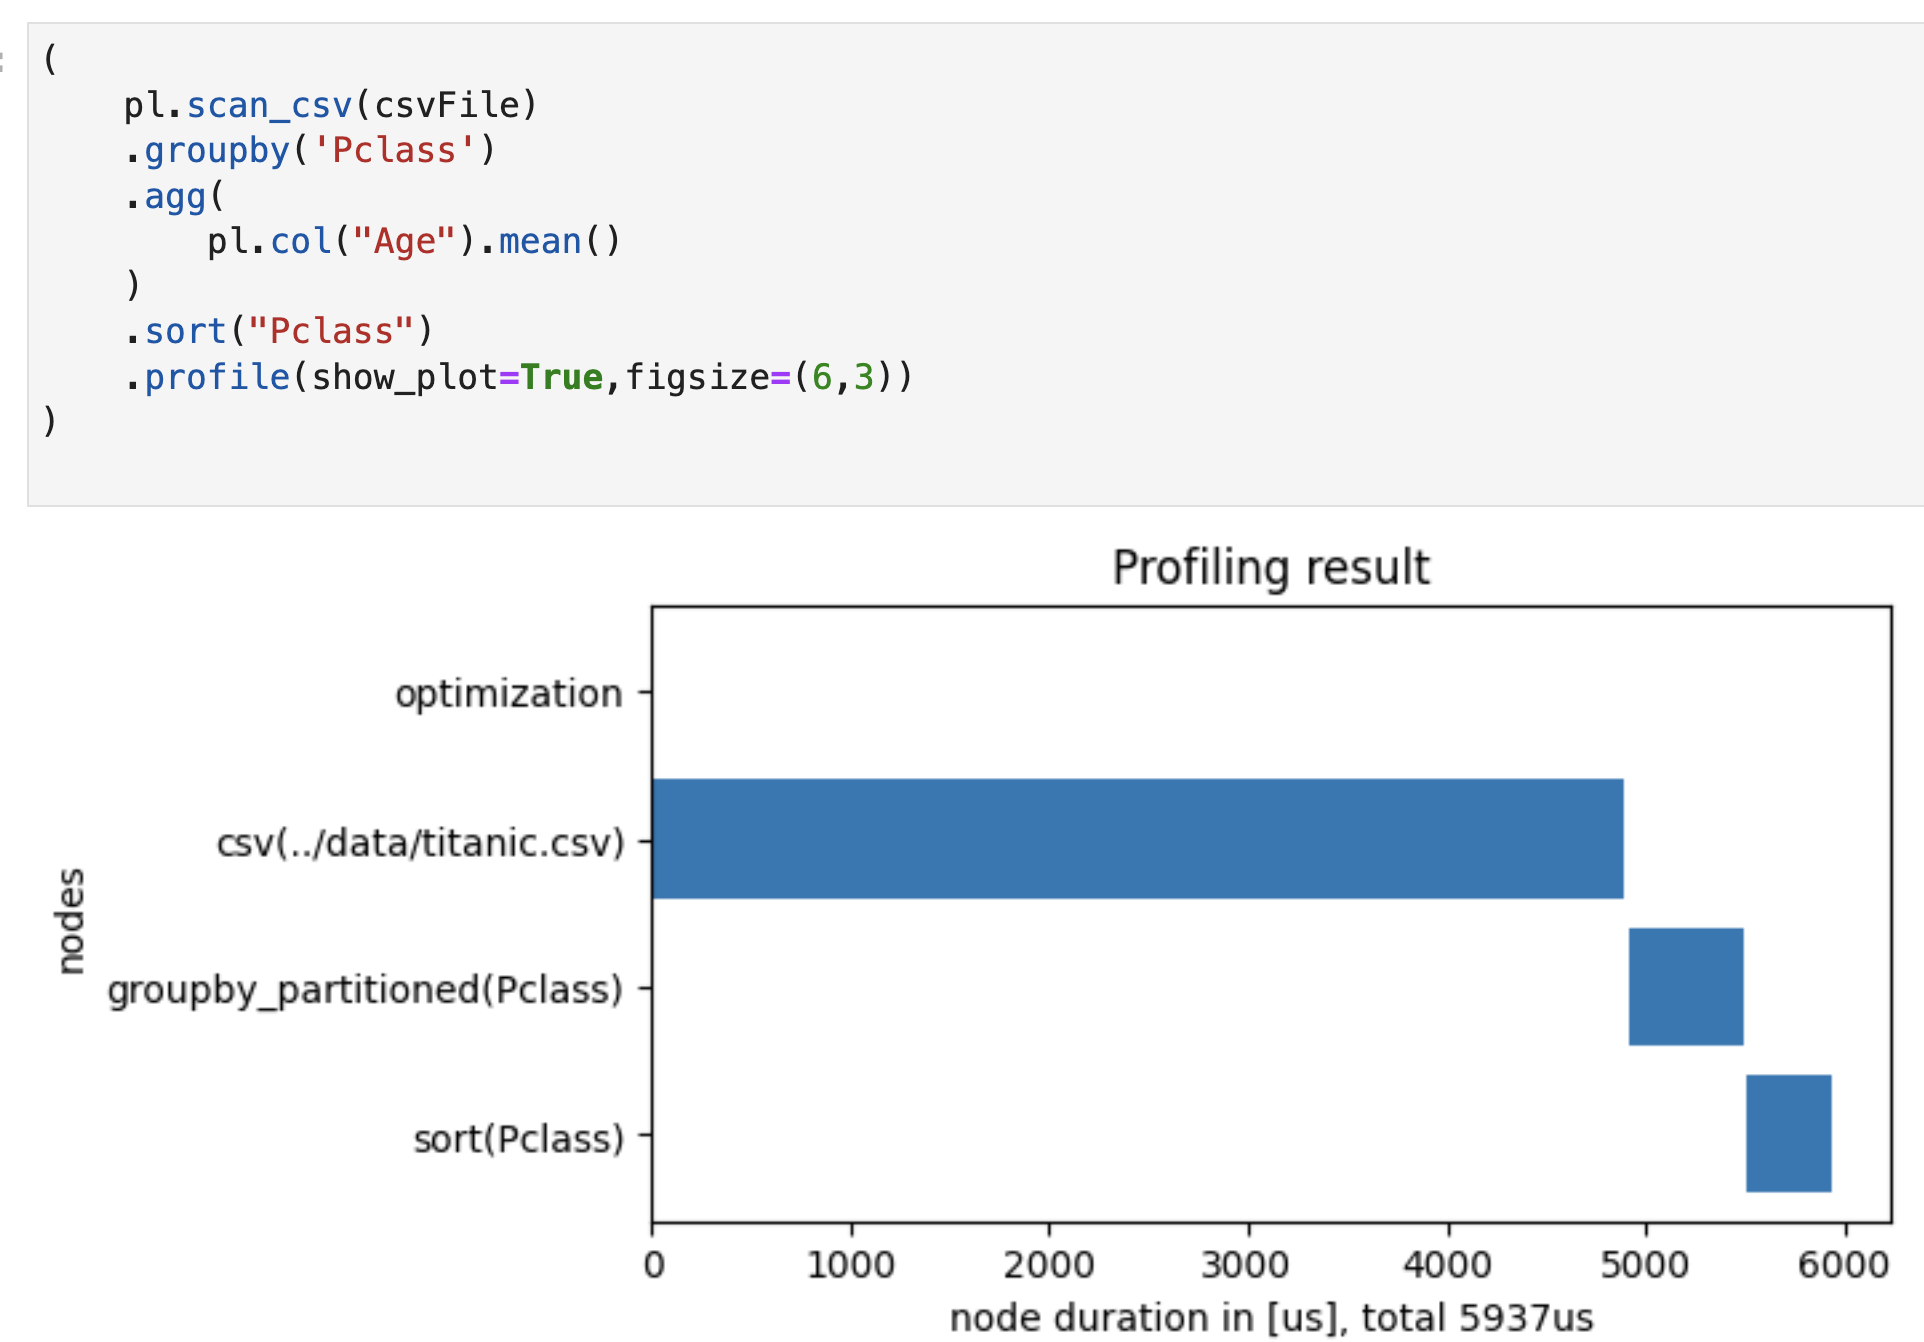
In the chart we see that reading the CSV file is the bottleneck. So we should focus our efforts on that step with strategies like specifying dtypes or - even better - converting to Parquet or Arrow.
Learn more
Want to know more about Polars for high performance data science and ML? Then you can:
- join my Polars course on Udemy
- follow me on twitter
- connect with me at linkedin
- check out my youtube videos
or let me know if you would like a Polars workshop for your organisation.